Resources
Analytics Software – Shopping Mall
Counting solutions designed for shopping centers
People
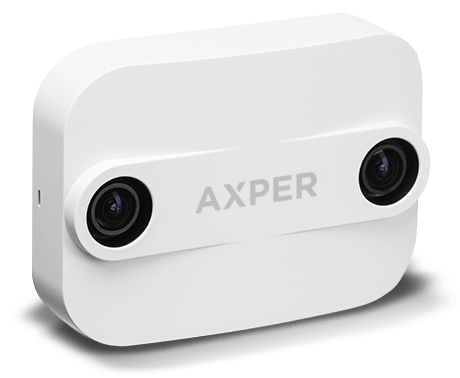
counting device
Our 3d stErEoscopiC camera
Our camera uses stereoscopic vision to ensure the highest level of accuracy for people counting within various environments such as heavy traffic and is not affected by environmental issues.
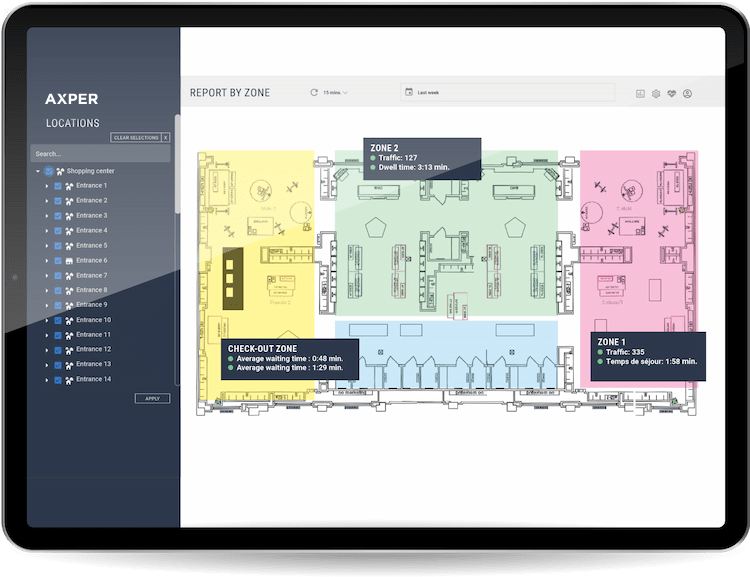
Axper analysis tool
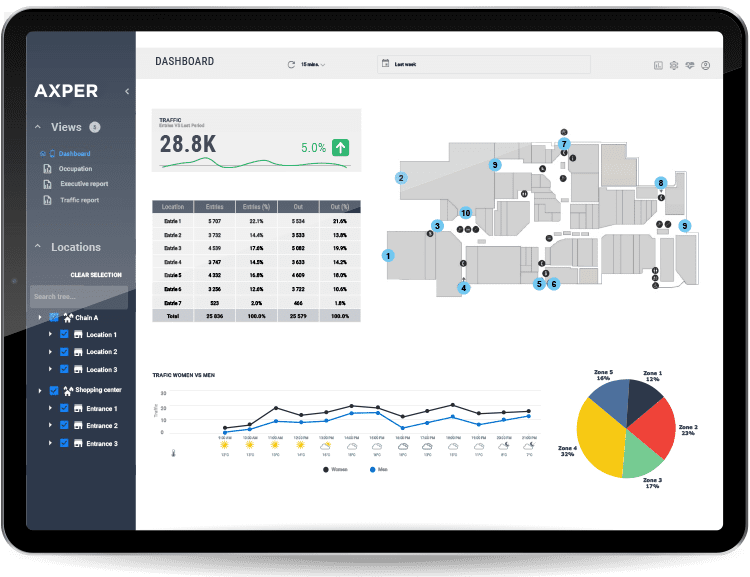
The Axper analysis tool is a flexible software that includes a custom dashboard, multiple zone reports, integration to your marketing promotions and the ability to create custom reports.
Our software offers valuable information for all management levels to make the right decisions, impact your business and drive sustainable growth. All of these in a friendly and modern environment.
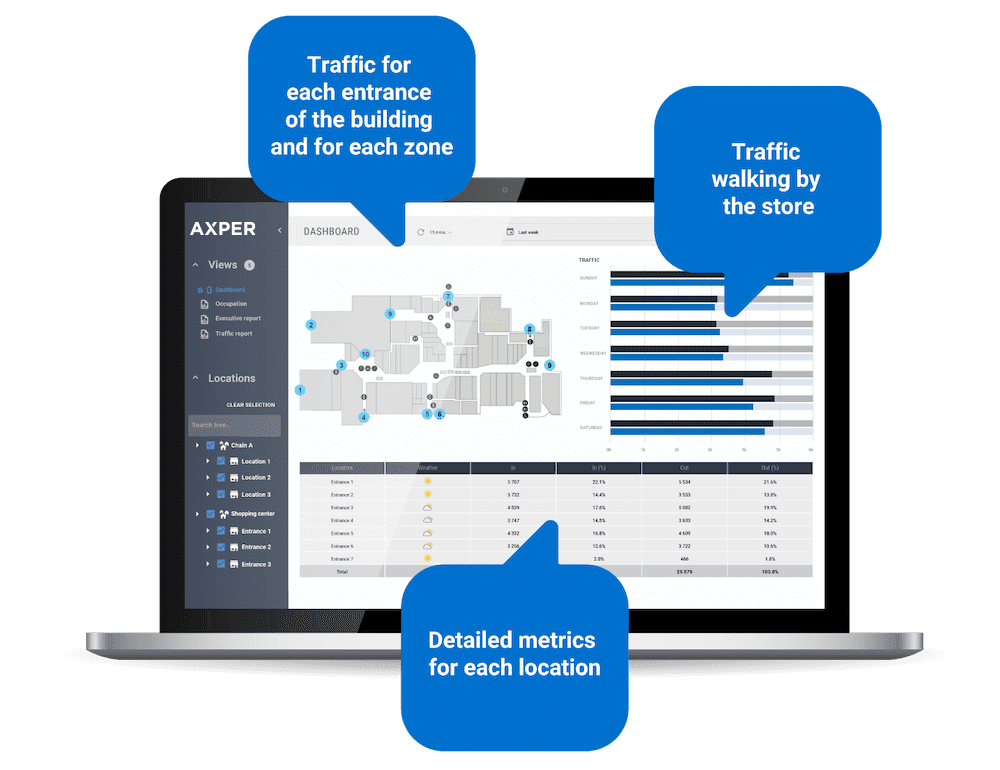
- Custom report creation tools
- Flexible reports by attributes: by banner, by region/territory/country and by real estate
- Visualize mall plan and indicators
- Facilitate the planning of location operational activities
Dashboard
- Visualize KPI’s in real time
- Customizable by user
- Easy monitoring of performances vs objectives
- Easily identify performance improvements opportunities
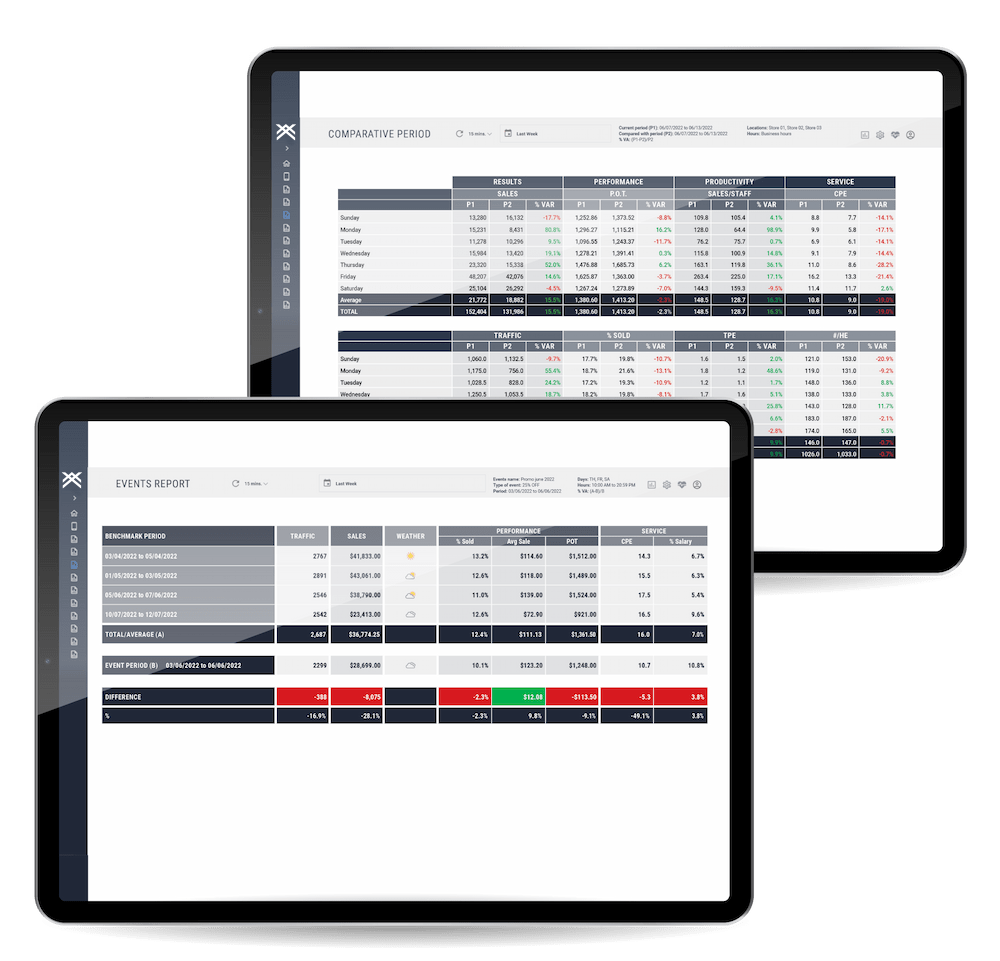
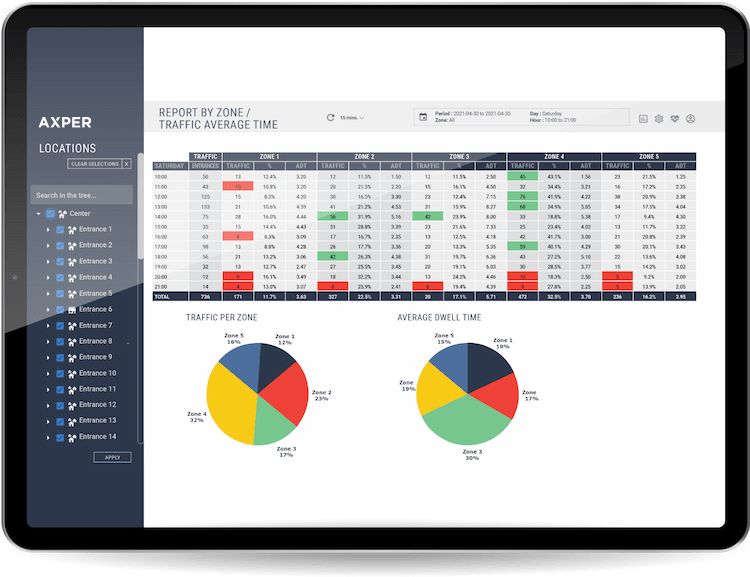
Customizable reports
- Quickly identify the impact of events on the traffic between locations, periods, regions, etc.
- Highlight the KPI’s trends: what works and what can be improved
- Plan objectives based on measurable data
- Flexible reports and analysis to evaluate specific events such as: promotions, advertising and mailing
- Evaluation of shopping and buying patterns for different periods
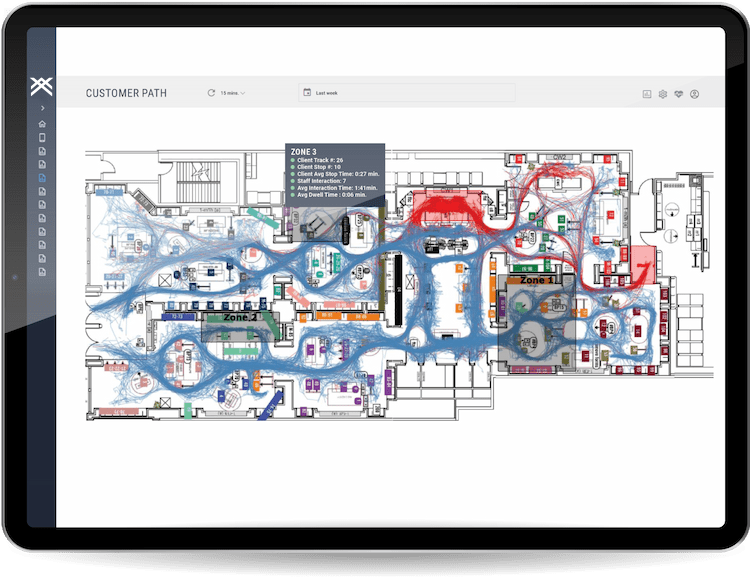
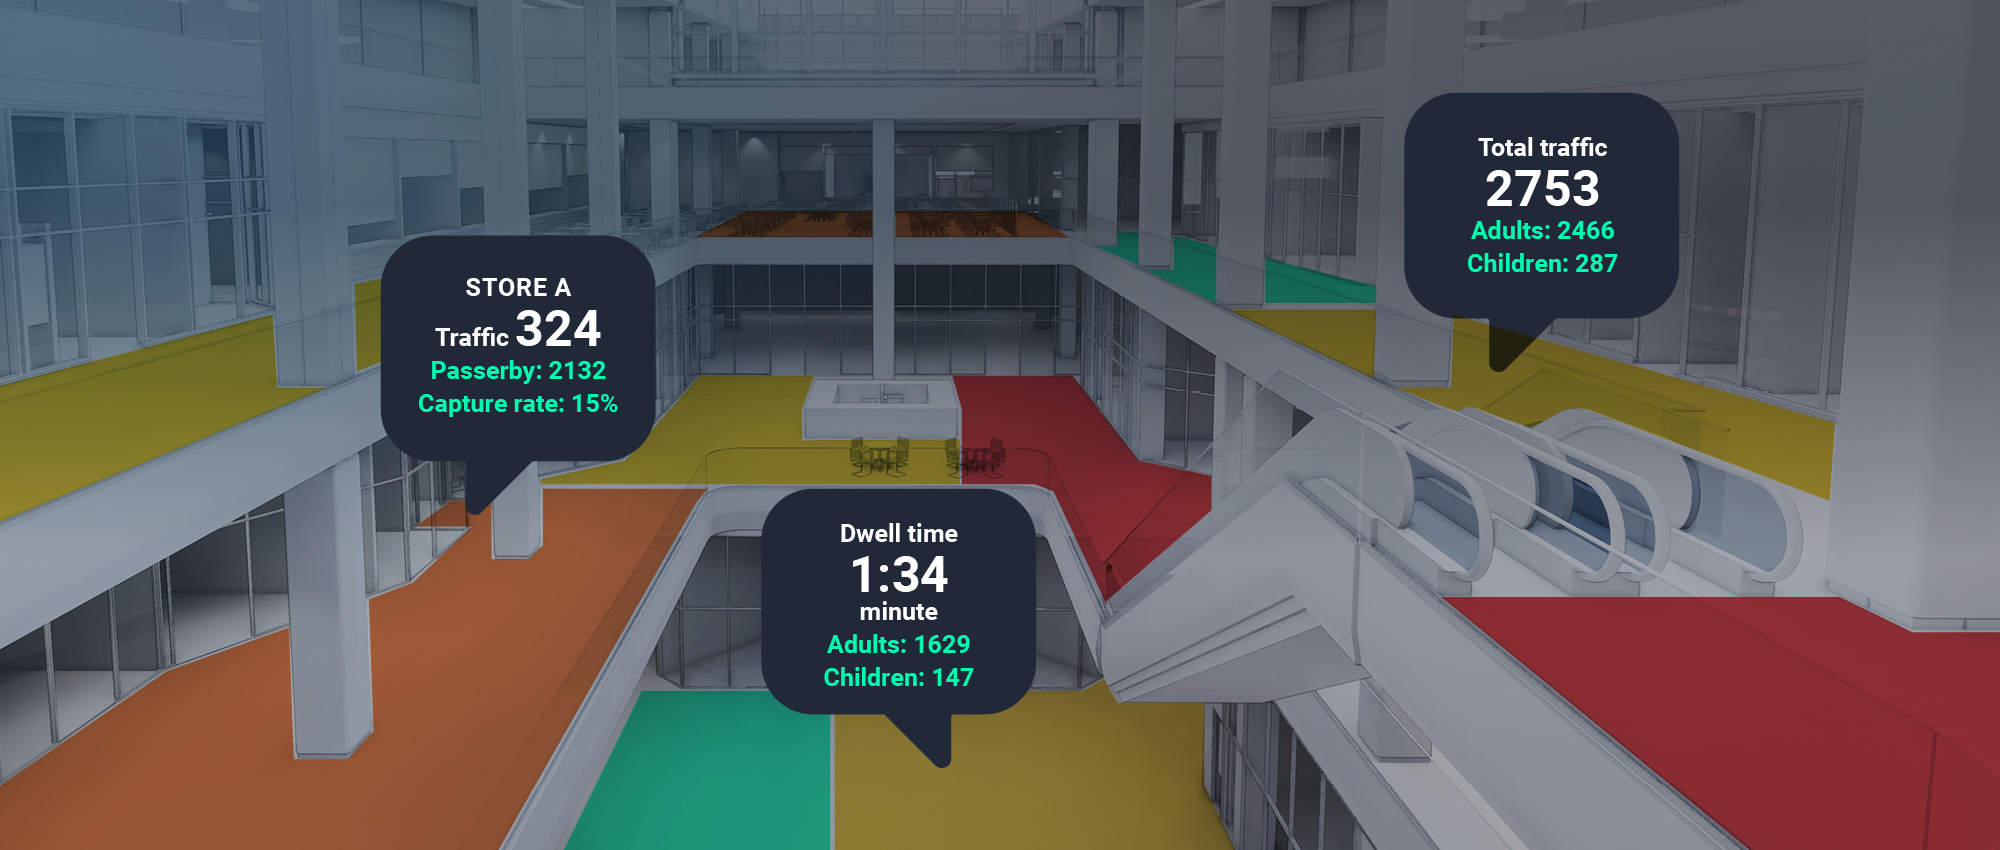
Demographic analysis and customer behavior
Our software suite provides a lot more than traffic data
- Traffic per zone
- Gendre and age
- Average time per zone
- Queue management
- Service delay
- Visit duration (average dwell time)
- Frequency (multiple dates and times of visits)
- New & repeat visitors (optimizing shopper’s experience for continued repeat visits)
- Bounced traffic (customers that walked in & left within a defined time period)
- Passerby traffic (customers that walked in front of location)
- Dwell time within your business location or per zone
- Customer loyalty (how often people return and time lapse between each visit)
- Other metrics customizable according to user needs
Features
- Heat map
- Customization of metrics
- Easy access to your historical data
- Customizable email alerts based on your metrics tresholds
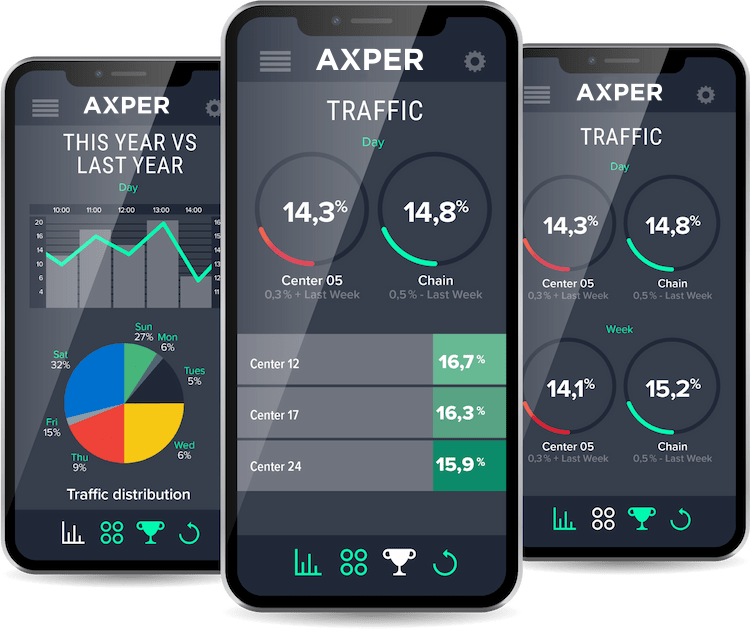
Axper Mobile
Application
Track your key performance indicators and your traffic data directly on your mobile device, and compare your current results with previous periods.
Other products datasheets for people counting and
occupancy and capacity management
How can we help you?
Axper’s professionals enjoy helping their client find the right solution.
Our recommmendations are always packaged and priced to meet your objectives.
Fill in the form below and one of our advisers will get back to you.
Mandatory fields are indicated with an asterisk (*)
"*" indicates required fields