Reliable data to manage occupancy and capacity.


Whether for security purposes or for an accurate tally of people in a specific area of your shopping mall, Axper’s occupancy and capacity management solution can be tailored to your needs.

How is occupancy calculated?

1.

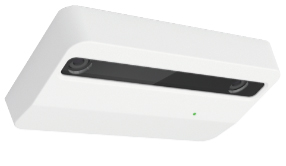
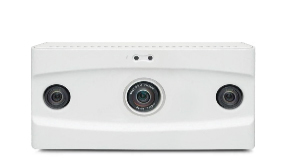
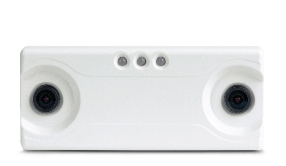
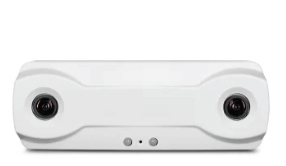
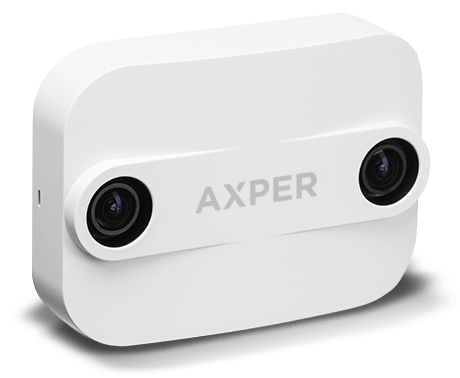
High precision people counters are installed in the zone or area where people enter and leave.

Diapositive - Illustration démontrant la technologie de comptage d'occupation d'édifice (3) Slide - Illustration that demonstrate the building occupancy count (3)

2.

The counters send data on the movement of people to the Web app in real time.

Diapositive - Illustration démontrant la technologie de comptage d'occupation d'édifice (3) Slide - Illustration that demonstrate the building occupancy count (3)

3.

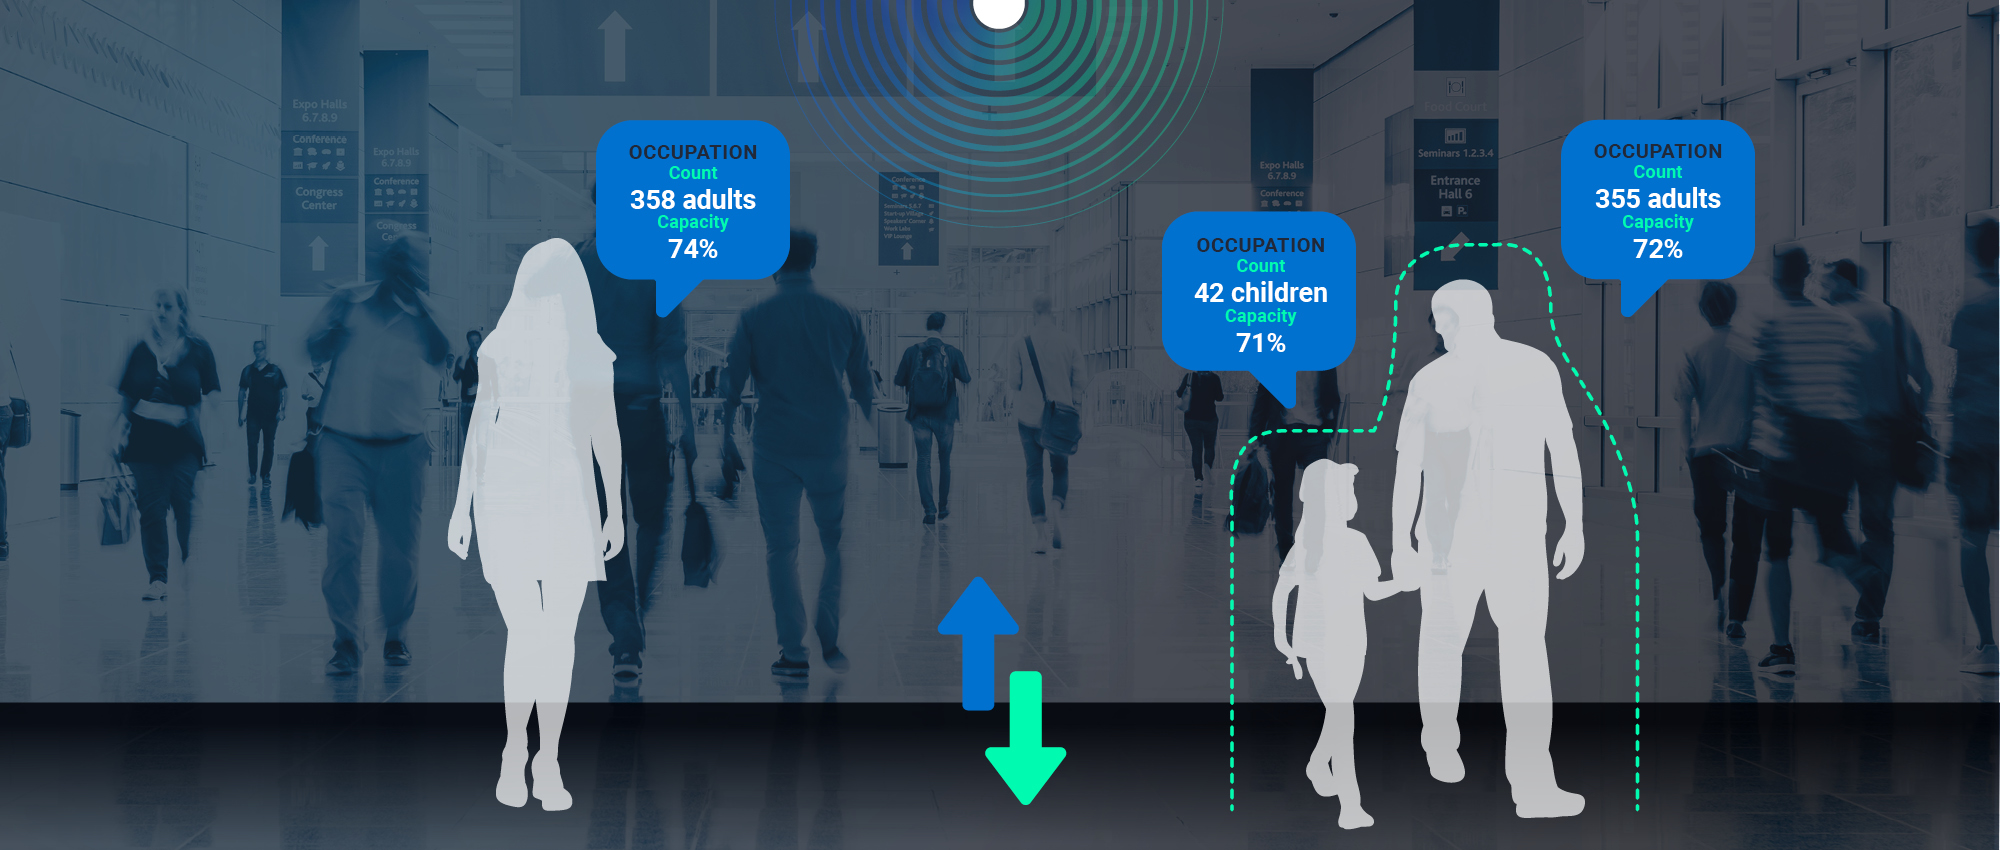
The system can differentiate between security guards, employees and children.
Diapositive - Illustration démontrant la technologie de comptage d'occupation d'édifice (3) Slide - Illustration that demonstrate the building occupancy count (3)
Photo that show 3 persons in a mall and the info bubbles tells us that the occupation count is at 358 adults which is 74% capacity. We also see a child and a parent which also have occupation numbers of 71% for the child and 72% for the grownup.

You already own
people counters?

Your current counters are certainly compatible with our occupancy and capacity management solution.
Book a meeting with one of our specialists to assess your current installations.
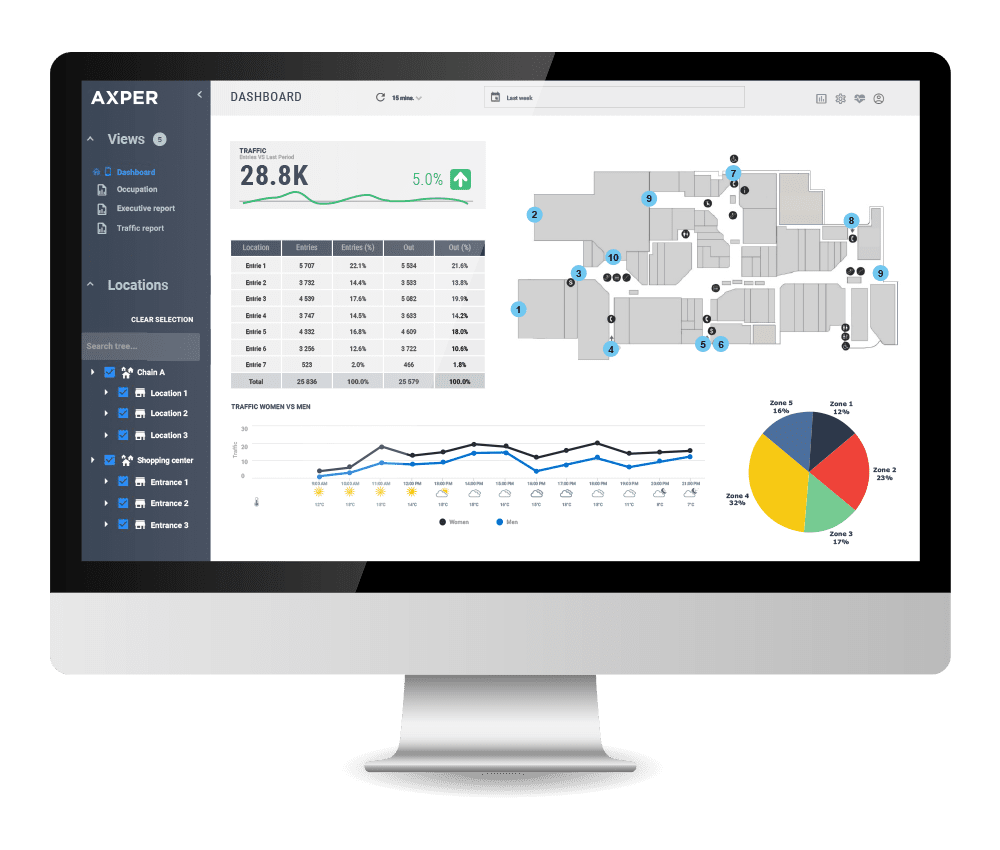
Computer showing a floor plan of where they have installed the readers for people entering the shopping center and a graph detailing people entering and where they are.

A solution
tailored to
your building

The data can be integrated, through our API, to:

  • All shopping mall software (Smart Building)
  • BMS or HVAC systems to adjust ventilation with occupancy
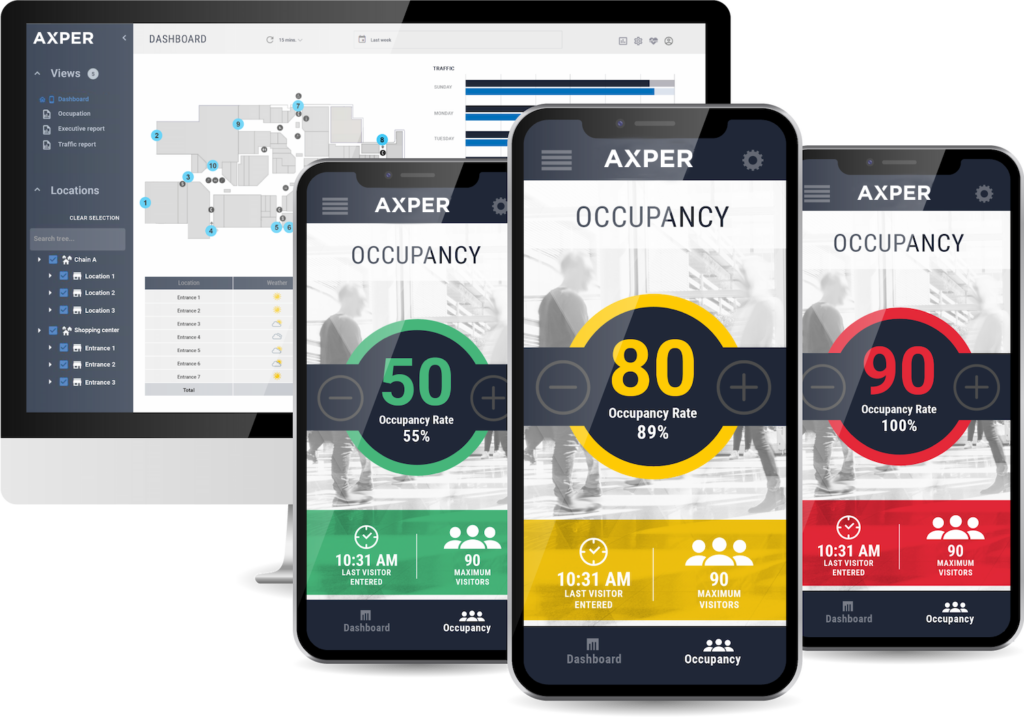
We see a tablet with floor plan and zones, we also see three mobile phones that shows occupancy rate in percentage. 55% is green, 89% is yellow and Red is 100%

Axper Applications

Track your occupancy and capacity data in your preferred format to make quick and informed decisions.
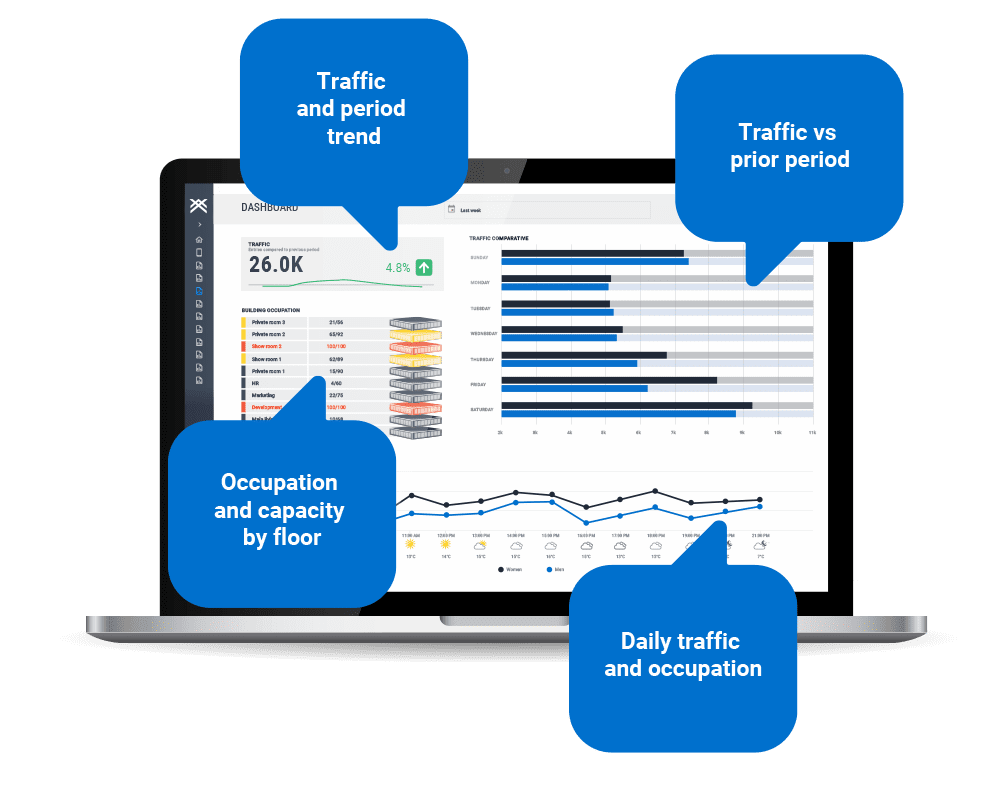
Key Performance
Indicators

All the performance indicators you need are presented in a simple and user-friendly interface, so you can make the right decisions at the right time.


  • Track performance in real time
  • Recommended actions
  • Customizable dashboards
  • Executive reports
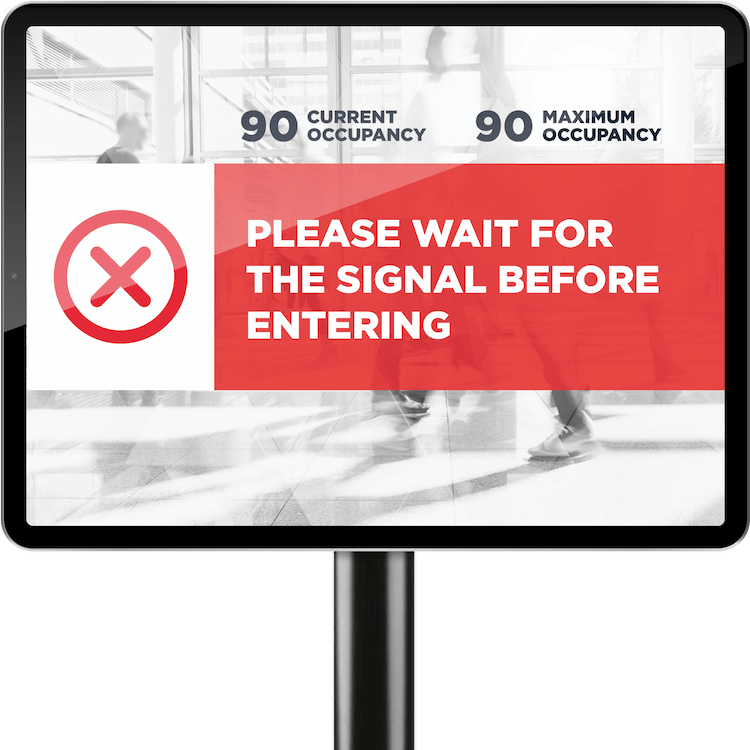
We see a tablet on a short pole. The graphic on the tablet says: "Please wait for the signal before entering" and the current occupancy and the maximum occupancy.

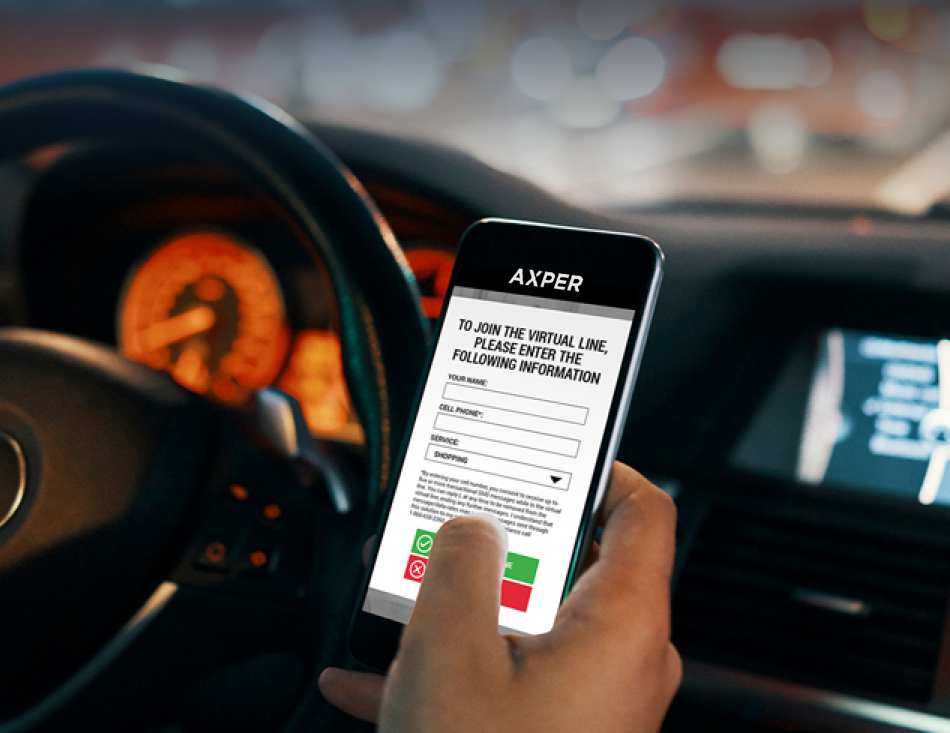
Don’t make your clients wait in line, use the virtual queue.

Image of a cellphone in a car, displaying the waiting line application from Axper. The screen reads "To join the virtual line, please enter the following information".

Digital display

The availability is displayed on a screen at the entrance of a specific space. Clients are automatically informed of the moment they can enter. No need to use a human resource to manage traffic.

Automatic queue management

The client signs in using his phone and receives a notification when there is availability.


Learn more

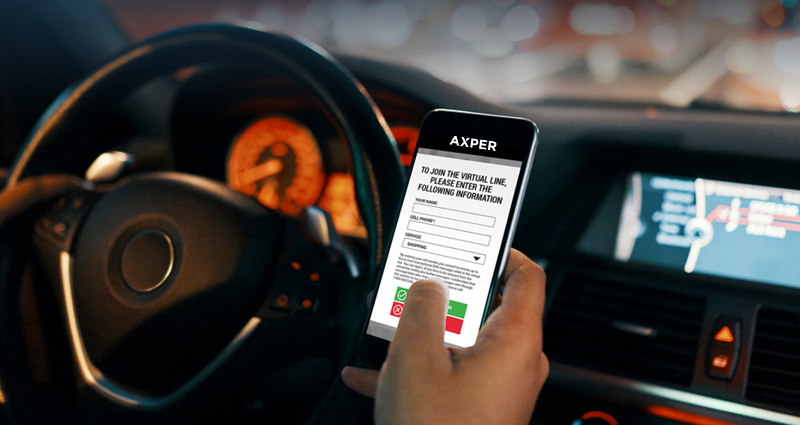
Mobile image of a cellphone in a car, displaying the waiting line application from Axper. The screen reads "To join the virtual line, please enter the following information".

Digital display

The availability is displayed on a screen at the entrance of a specific space. Clients are automatically informed of the moment they can enter. No need to use a human resource to manage traffic.

Automatic queue management

The client signs in using his phone and receives a notification when there is availability.


Learn more

Interested in
a demonstration?


Book a meeting with one of our specialists.

Check out our people counting
solution for shopping malls