You deserve
only the best!
Provide the power of our software to all levels of management: store, regional and corporate office.
Potential and performance analysis tool that will provide recommendations based on measurable facts to maximize store sales potential, which allows you to optimize increases on store performance on traffic (POT) and staff productivity. Our software facilitates the evaluation of the sales results by grouping KPI’s in three segments: sales performance, staff productivity and customer service level.
This proven tool also provides regional and store managers with the ability to set their customer service level and control wage costs.
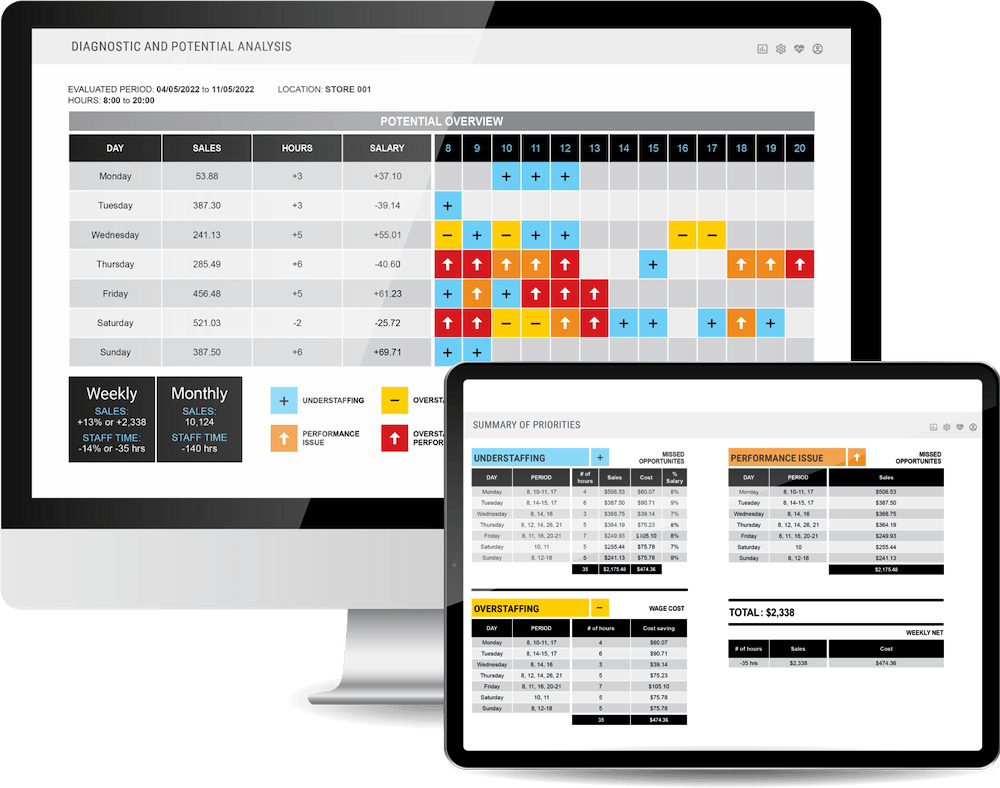
Potential analysis
- Identify daily periods with additional sales potential
- Suggest actions by drilling down into the identified periods with potential sales increase
- Optimize wage costs while maximizing sales
- Optimize your customer service level to maximize sales opportunities
- Improve staff productivity
- Assist in planning your in-store operational activities
Retail analysis
The Axper analysis tool is a flexible software that includes a custom dashboard, potential analysis, a summary of priorities and key executive reports.
Our software offers valuable information for all management levels to make right decisions, impact your business and drive sustainable growth. All of these in a friendly and modern environment.
- Easy to integrate and user-friendly
- Customizable by user
- Flexible reports by attributes: by banner, by region/territory/country, by sales volume, by real estate – street locations, mall locations, outlets, etc
- Collects traffic data for in-depth analysis
- Planning of clear and measurable strategies
- Highlight the potential and identify actionable opportunities
- Facilitate the planning of in-store operational activities
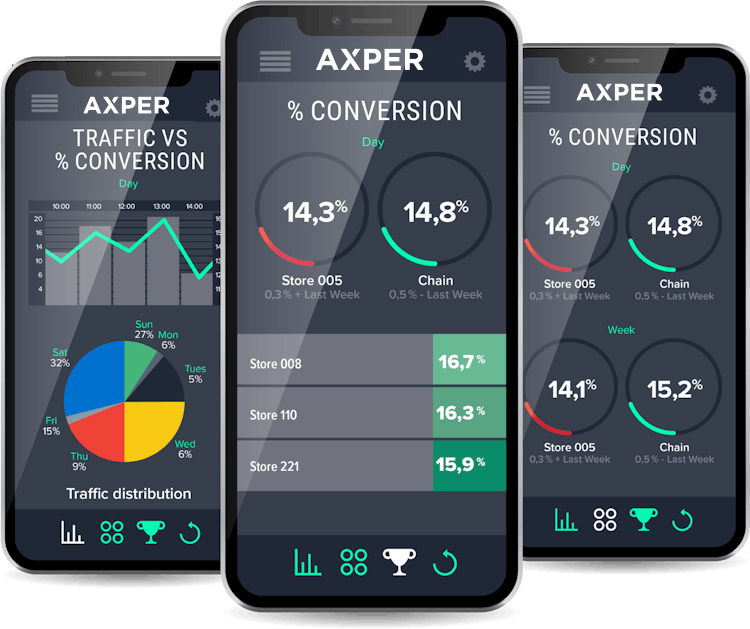
- Accessible from most mobile platforms
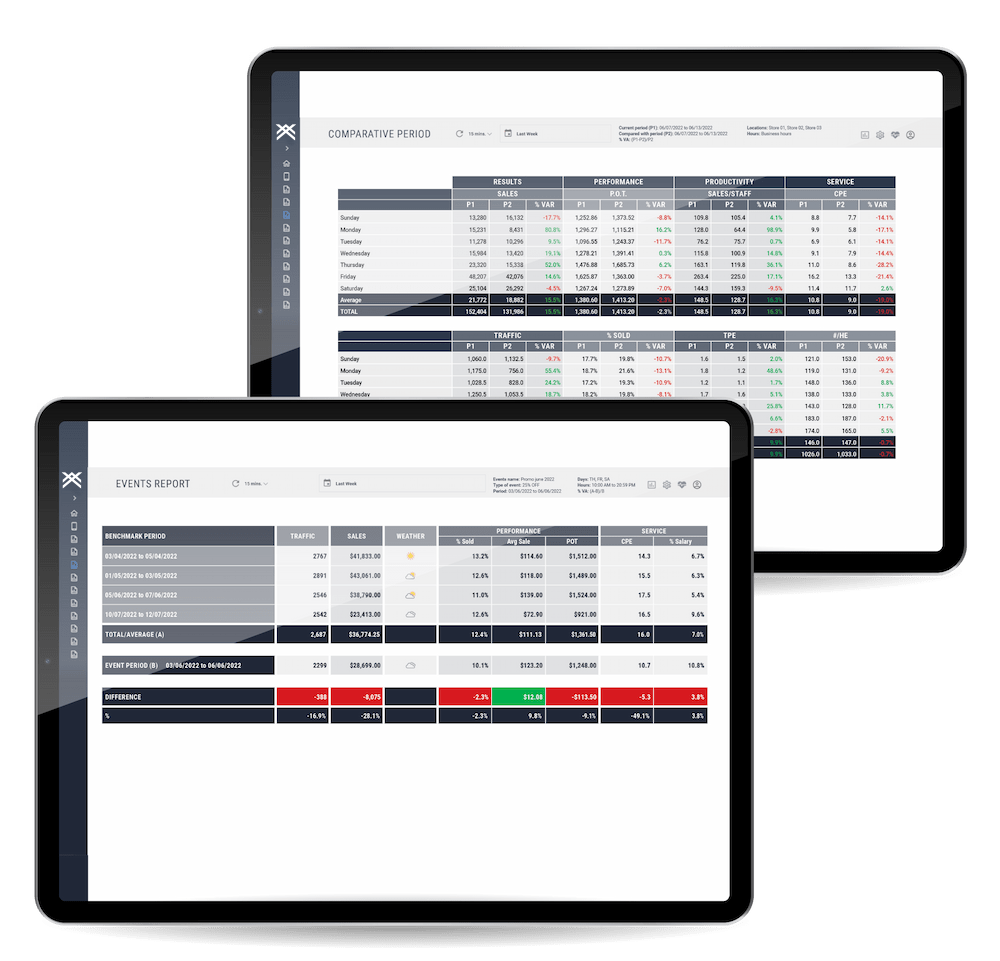
Report & Dashboard
- Quickly identify the impact of each KPI on the sales results between stores, periods, regions, banners, etc.
- Highlights the KPI’s that need to be maintained and those to be addressed
- Plan sales objectives based on measurable facts
- Flexible reports and analysis to evaluate specific events such as: promotion, advertising, mailing, product positioning, window displays, etc.
- Evaluation of shopping and buying patterns for different periods
- Identifies contribution by location based on potential
- Visualize the KPI’s in real time
- Customizable by user
- Easy control of fixed objectives
- Quick view of good performances and those needing to be addressed
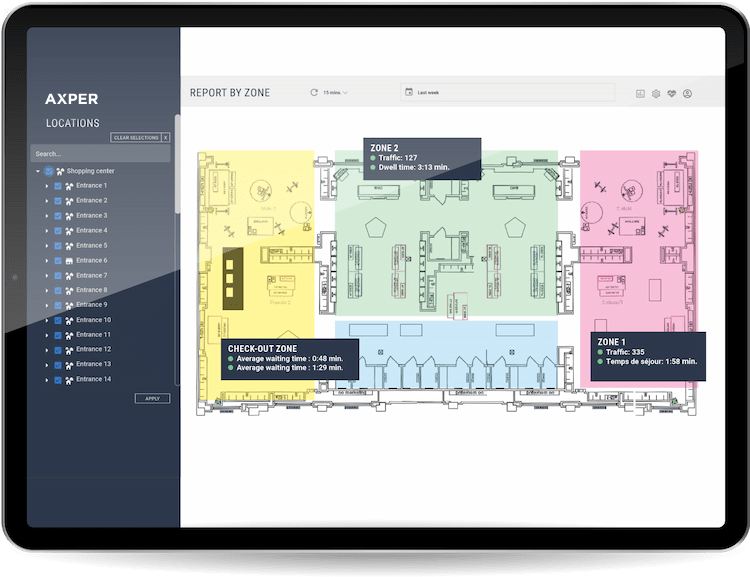
In-store analytics & customer behavior
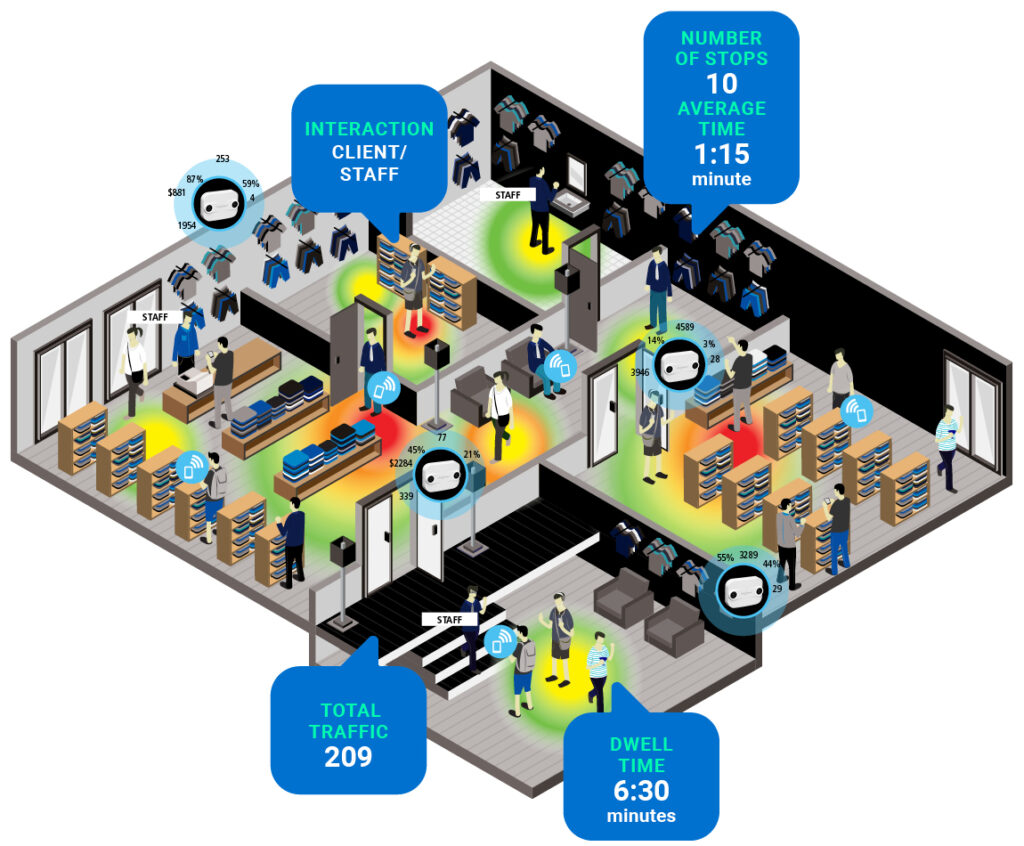
Our software suite provides more than just traffic counts
The Axper technology can provide:
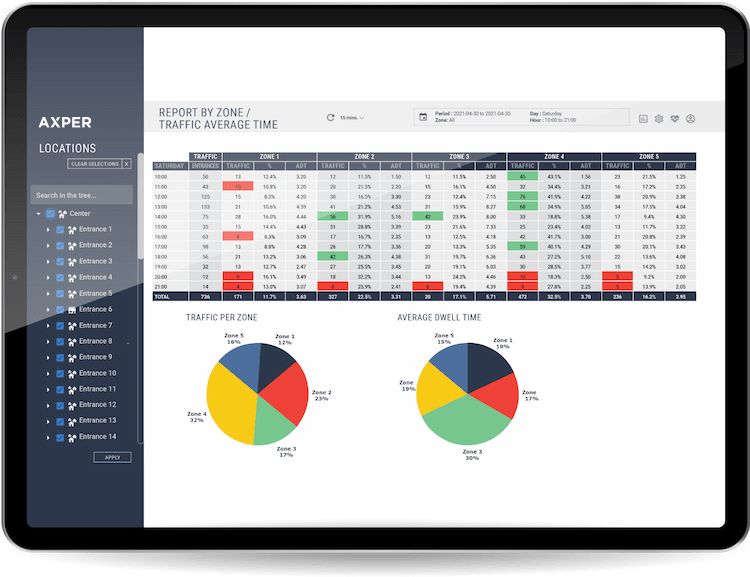
- Traffic per zone
- Site or zone occupancy rate
- Average time per zone
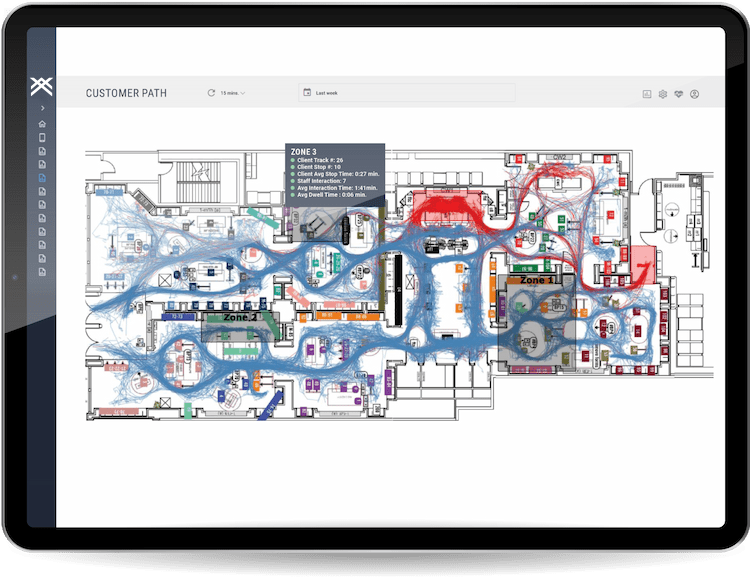
- Path to purchase
- Heat map
- Queue management
- Service delay
- Other metrics can be customized according to user needs
Features
- Customization of metrics
- Production of history reports
- Configuration of metrics tresholds
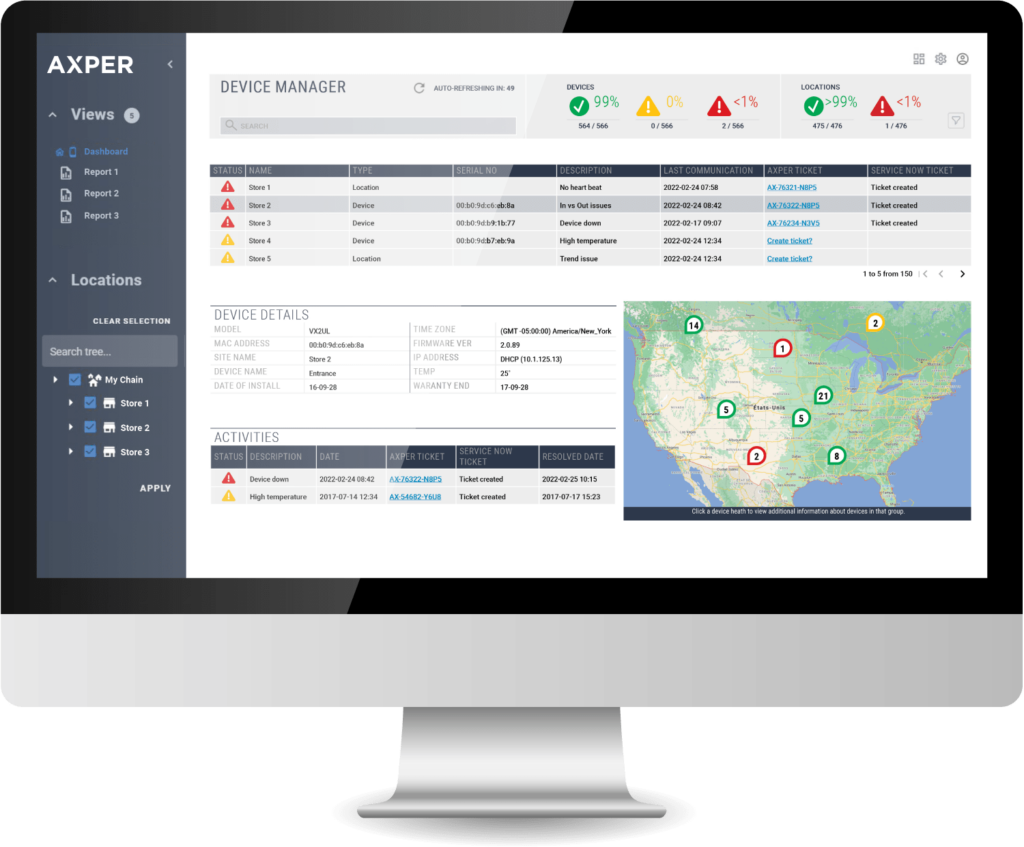
- E-mail alerts at specified metrics thresholds
- Automatic or manual resetting of metrics
- Manual adjustment of customized metrics
- Real-time version compatible with most mobile platforms
Other products datasheets for people counting and
occupancy and capacity management
How can we help you?
Axper’s professionals enjoy helping their client find the right solution.
Our recommmendations are always packaged and priced to meet your objectives.
Fill in the form below and one of our advisers will get back to you.
Mandatory fields are indicated with an asterisk (*)
"*" indicates required fields