The Axper analysis tool offers a custom dashboard, multiple types of reports and different views of your store showing the movement of the clientele.
- Easy to integrate and user-friendly
- Customizable by user
- Flexible reports by attributes such as by banner, by region/territory/country, by sales volume, by real estate – street locations, mall locations, outlets and more
- Planning of clear and measurable strategies
- Highlight the potential and identify actionable opportunities
- Facilitate the planning of in-store operational activities
- Accessible from most mobile platforms
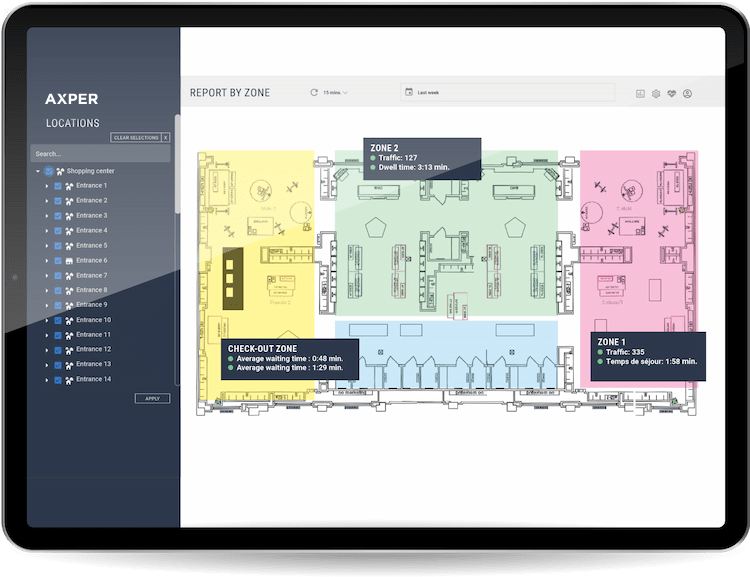
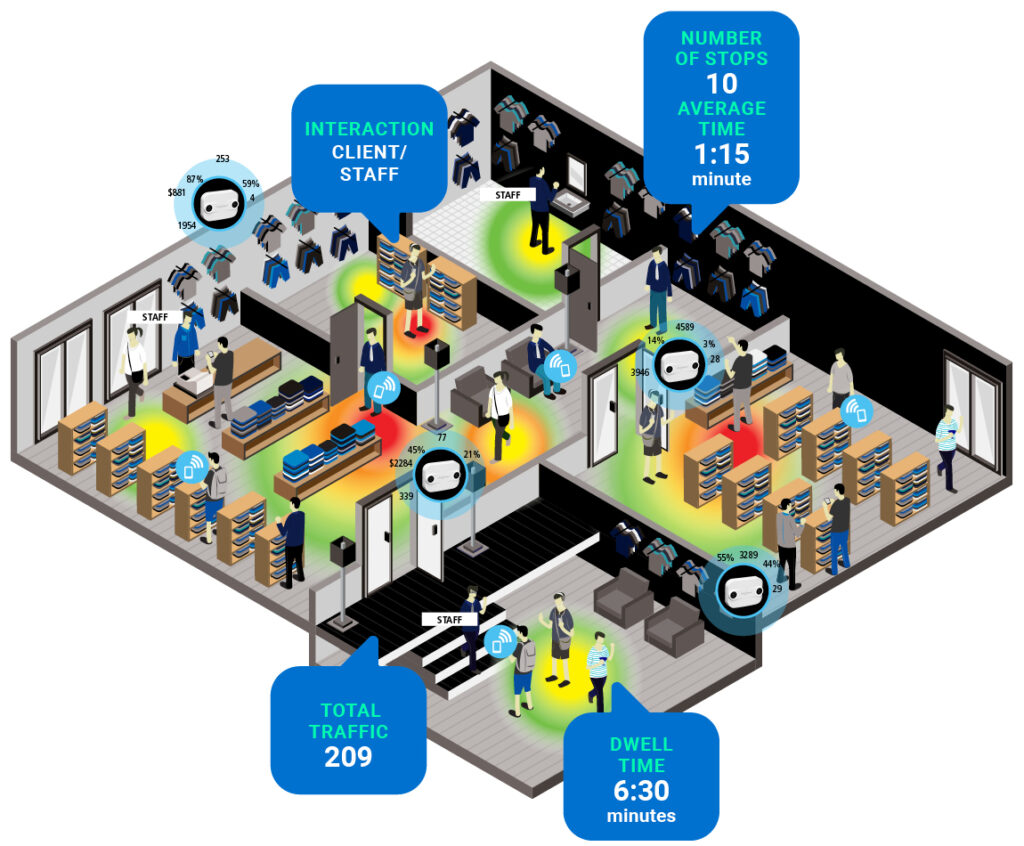
Analysis per zone
- Identify the busiest zones of your stores (heat zones)
- Know the average dwell time per designated area
- Improve product positioning, marketing strategies and customer service
- Define stops per zone
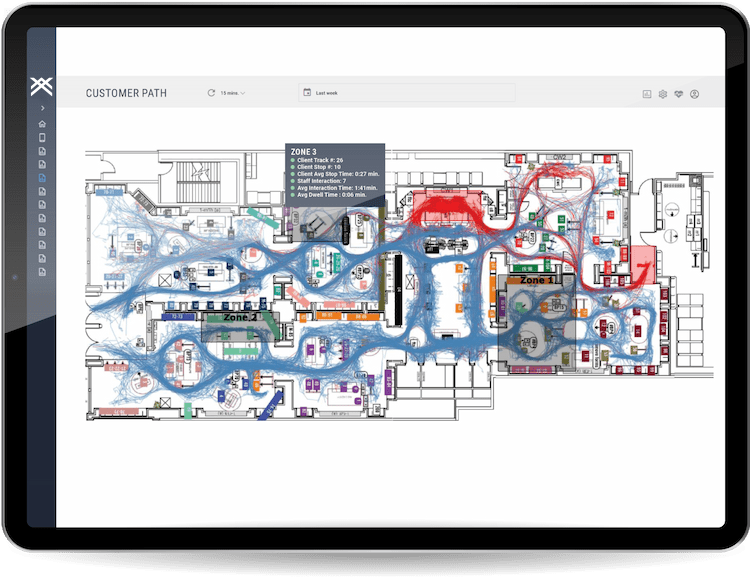
Path to purchase
- Follow your customers from A to Z
- Identify which aisles are most used
- Improve store layout to optimize customer’s experience
- Place advertisements and product discounts more efficiently
- Differentiate staff from customers
- Plan your in-store operational activities
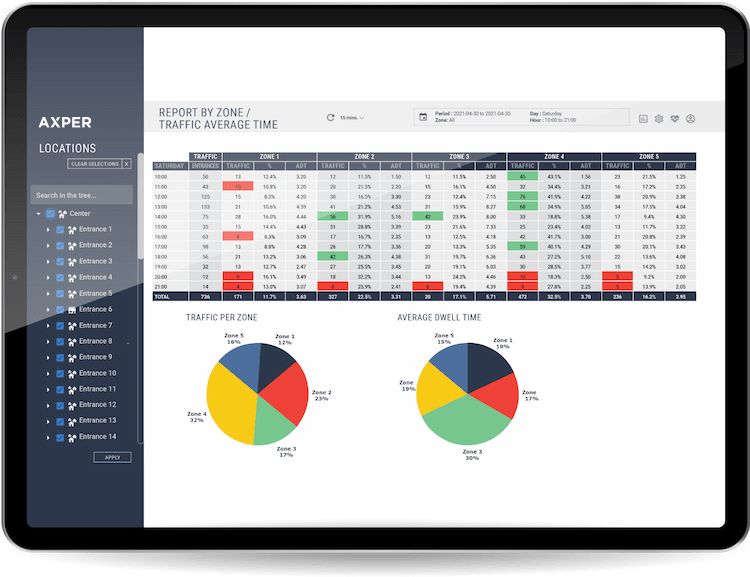
Customizable reports
- Quickly understand the metrics behind your traffic counts
- Compare between stores, periods, regions, banners, etc.
- Analyze your performance based on the real numbers
- Set a benchmark and realistic performance objectives
Features
- Customization of metrics
- Production of historical reports
- Configuration of metrics tresholds
- E-mail alerts at specified metrics thresholds
- Real-time version compatible with mobile devices
- Automatic or manual resetting of metrics
- Manual adjustment of customized metrics
- Real time widget for Windows stations
Other products datasheets for people counting and
occupancy and capacity management
How can we help you?
Axper’s professionals enjoy helping their client find the right solution.
Our recommmendations are always packaged and priced to meet your objectives.
Fill in the form below and one of our advisers will get back to you.
Mandatory fields are indicated with an asterisk (*)
"*" indicates required fields